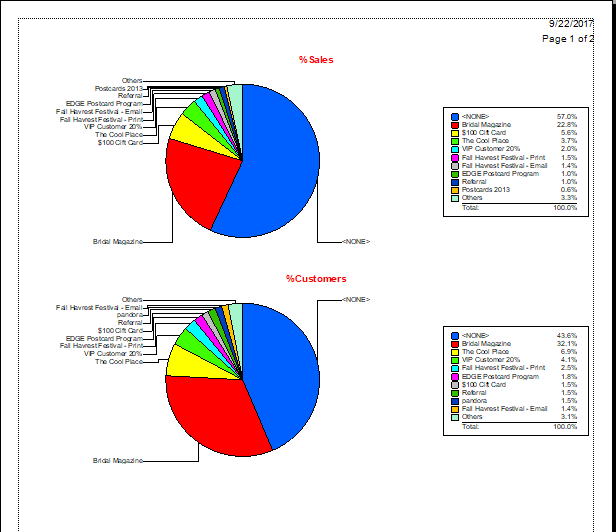
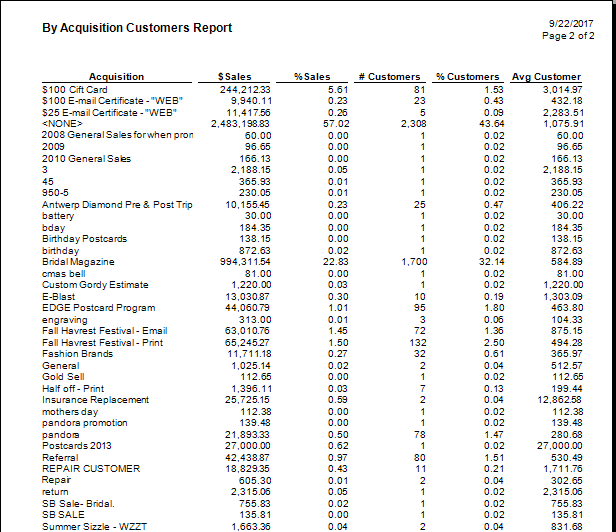
The By Acquisition report shows sales according to how the customer came to be a customer as indicated by the Why In field on the Point of Sale (POS) window. It requires only that you select a time frame.

|
Pie Chart Data
|
|
|
|
% Sales
|
Percent of sales by type of acquisition.
|
|
|
% Customers
|
Percent of customers by type of acquisition.
|

Data fields in the By Acquisition report include:
|
Acquisition
|
The type of acquisition.
|
|
$ Sales
|
Dollar amount of sales generated by type of acquisition.
|
|
% Sales
|
The percentage of sales generated by type of acquisition.
|
|
# Customers
|
The number of customers in each type of acquisition.
|
|
% Customers
|
The percentage of customers in each type of acquisition.
|
|
Avg Customer
|
Amount spent on average by each customer in that type of acquisition.
|
NOTE: In the By Acquisition report, for records where no acquisition type was recorded, they will appear as None. On the pie chart, the top 10 acquisition types are displayed, and Other contains totals for all the others.