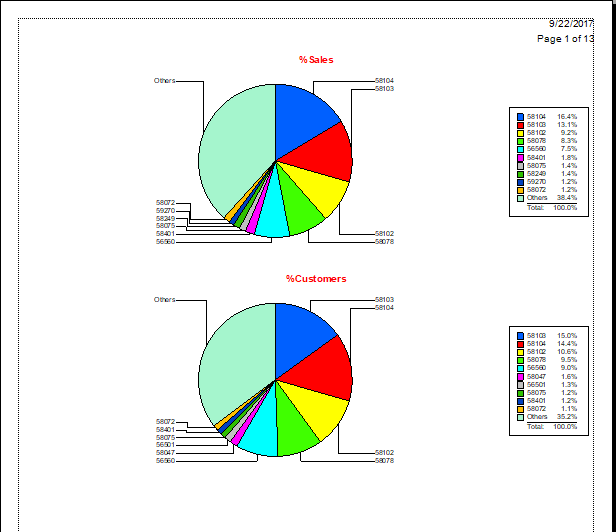
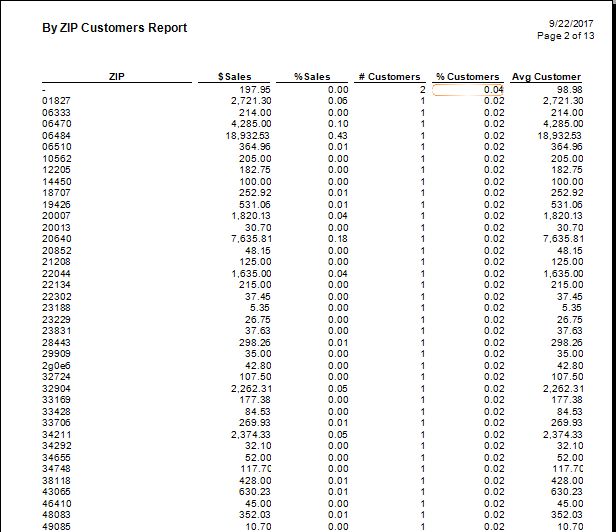
The By ZIP report shows the percent of customers in a period of time by ZIP Code and the percent of expenditures in a period of time by ZIP Code.
For more about report filters and settings, see the section entitled Creating a Report.

|
Pie Chart Data
|
|
|
|
% Sales
|
Percent of sales by zip code.
|
|
|
% Customers
|
Percent of customers by zip code.
|

Data in the By ZIP report includes:
|
Zip
|
The zip codes that are included.
|
|
$ Sales
|
Dollar amount of sales generated by each zip code.
|
|
% Sales
|
The percentage of sales generated by each zip code.
|
|
# Customers
|
The number of customers in each zip code.
|
|
% Customers
|
The percentage of customers in each zip code.
|
|
Avg Customer
|
Amount spent on average by each customer in that zip code.
|
NOTE: In the By ZIP report, for records where the customer has no preferred address, they will appear as None. On the pie chart, the top 10 zip codes are displayed, and Other contains totals for all others.