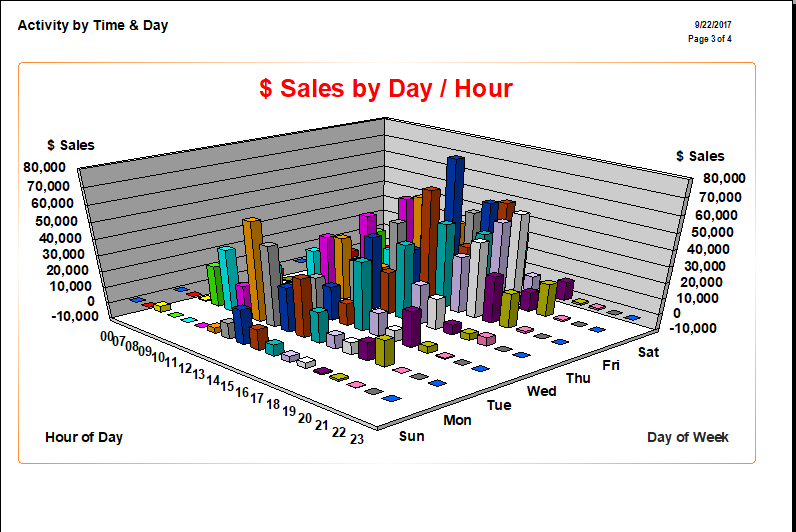
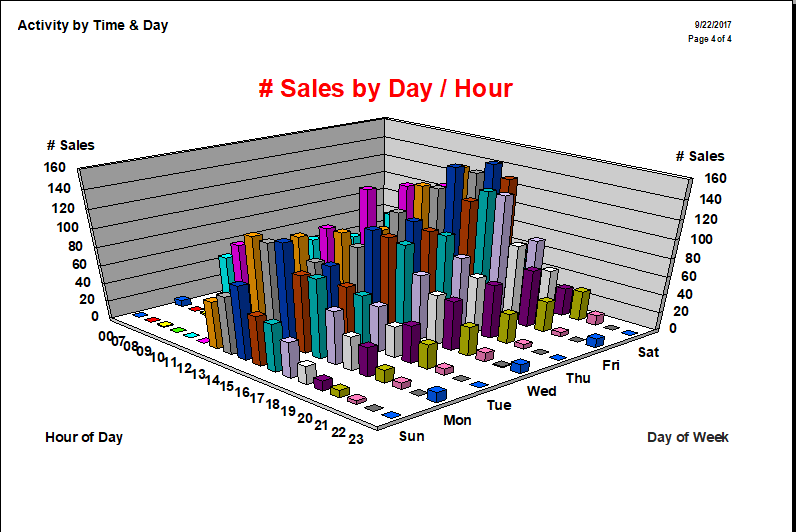
The Time & Day report details retail sales broken down by day of the week and hour of the day. It is helpful in determining store traffic patterns. This report also includes entries for sales by number of receipts. It uses the same query window as the Daily Activity report.
For more about report filters and settings, see the section entitled Creating a Report.
NOTE: This report is only useful if Point-of-Sale (POS) transactions are made in real-time.
The first page of the Time & Day report displays a chart with the days of the week across the top and the hours of the day along the left side. This tabulates sales by hour and day with totals for each category.

The second page of the Time & Day report shows the same data in a bar graph. This allows you to see at a glance what the peak times and days are.

A third page contains a similar graph containing the sales represented by number of receipts generated.
