A detailed rundown on how to work with the Customer Performance (previously named Customer Percentiles report) report once generated.
Results - Customer Percentile Report Example

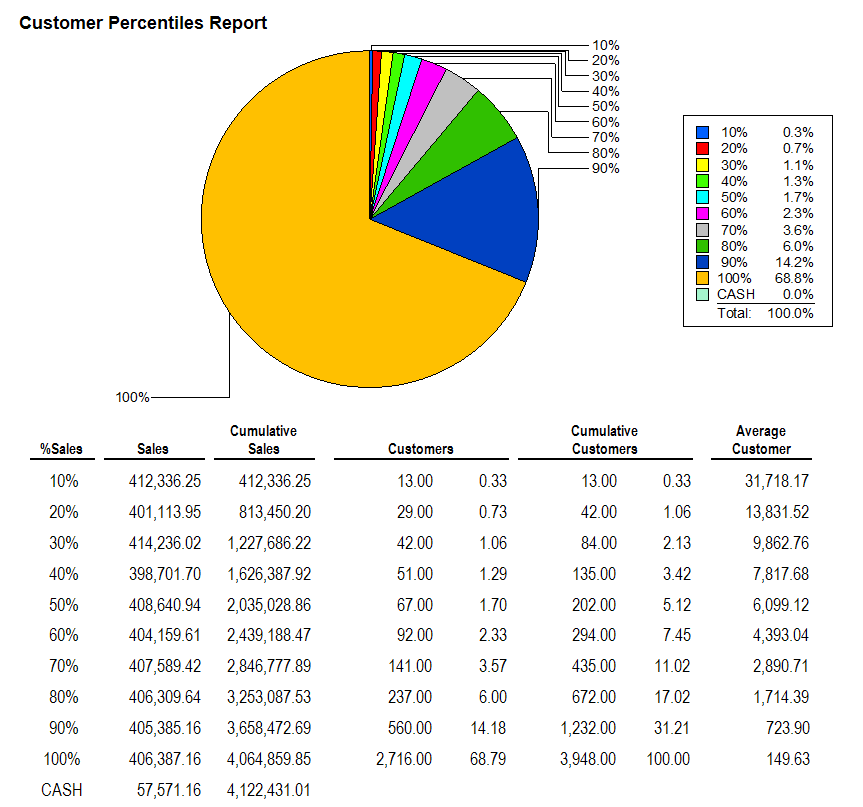
The first row of this example shows us that 10% of our total sales for the period ($412,336) came from just 13 customers and that, on average, each of these customers spent $31,718 at your store. To see who these customers are click on the Cumulative Sales number for that row.
Each row includes the numbers from all rows prior in the respective cumulative columns. The second row shows us that 20% of our total sales ($813,450) came from 42 customers. These figures include the customers from the first row.
Depending on your purposes, you may stop here and decide to target these 42 customers for a mailing. Or, you might keep working down the list and decide to be broader and target the 202 customers that constitute 50% of your sales.
NOTE: Remember, you can click on each Cumulative Sales number to see the underlying customers and, from this list view, you can get a print out of these customers or even create a mailing list for marketing purposes.