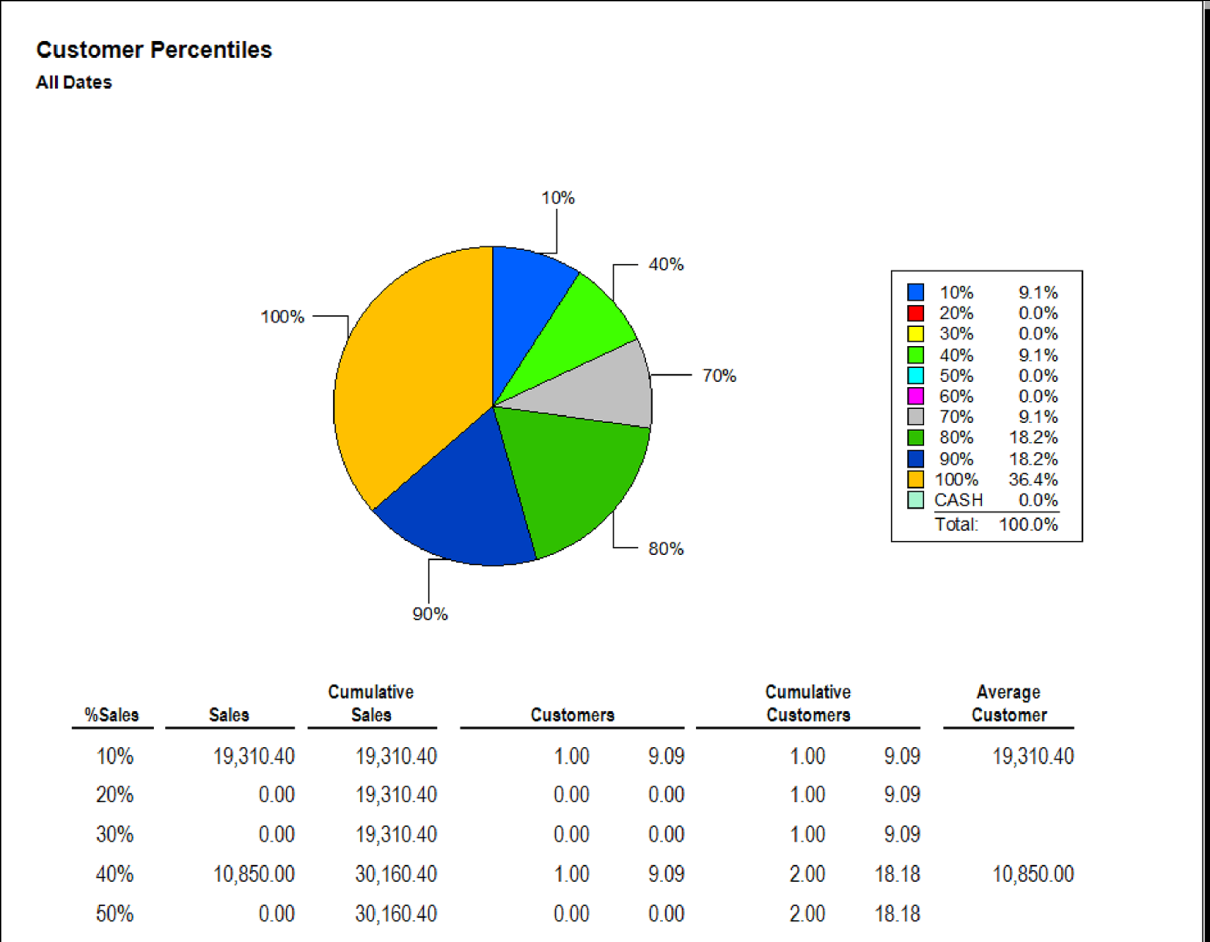
The Performance report, previously known as the Percentiles report, can be useful to know for marketing purposes what portion of your customers make up the largest portion of sales. For example, it is not unusual for 10 percent of your customers to generate 80 percent of your sales. The Performance report provides a percentage of sales as attributed to a specific section of your customer base. It requires only that you select a time frame.

Data fields in the Performance report include:
|
Pie Chart
|
Depicts the percentiles graphically.
|
|
% Sales
|
Percentage of sales in 10 percent increments.
|
|
Sales
|
The total sales in that percentile increment.
|
|
Cumulative Sales
|
A running total of sales including sales from the previous percentile category.
|
NOTE:
|
Clicking on a figure in the Cumulative Sales column of the Percentiles report will return the list of customers who made purchases toward it.
|
|
|
Customers
|
Number of customers in that percentile.
|
|
Cumulative Customers
|
A running total of customers including customers from the previous percentile category.
|
|
Average Customer
|
In that percentile, what the average customer spent.
|