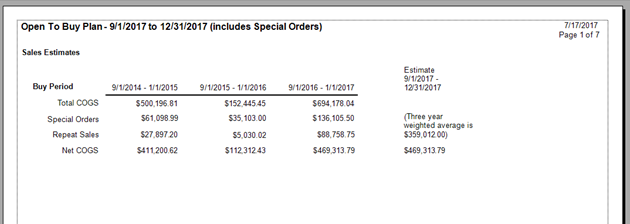
Page 1
Page 1 reiterates the input values for reference.
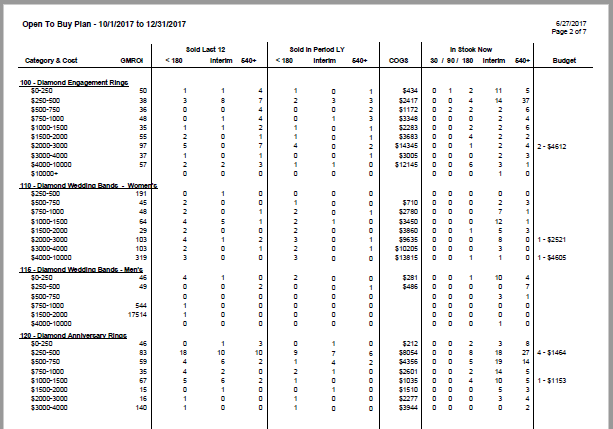
Page 2
The remainder of the output shows the results which will show what you sold, what you have, and what you might want to spend on replacement inventory.
The buying plan analyzes your inventory purchases and successful selling in previous years to offer suggested changes to the upcoming buying season. These changes amount to the OTB distribution of funds into different categories and price points.
For example, a category with a $10,000 investment may contain $5,000 worth of stock at a price point that sells rapidly in your store. The remaining $5,000 may be in a price point that is moving very slowing, or not at all. Based on past history, it may be determined that you do need items in this price point, just fewer than before.
NOTE: The Edge has an overriding rule that indicates that no matter how well a particular price point performed, we will never recommend that you buy so much that the new in-stock level exceeds two times the amount sold in the previous 365 days.
Data fields shown in the Open to Buy report include:
|
Category & Cost
|
The category and cost range being presented.
|
|
GMROI
|
The gross margin return on investment. The formula used to calculate this is profit divided by the cost of inventory.
|
|
Sold Last 12
|
The quantity of items in the category and cost range sold within the last 12 months. The quantity is broken down by turnover time: fast seller (less than 180 days), interim seller (180 days to 540 days), and those that took over 540 days to sell.
|
|
Sold In Period LY
|
The quantity of items in the category and cost range sold one year prior to the Buy Period as specified in step 1 on the UI screen. The quantity is broken down by turnover time: fast seller (less than 180 days), interim seller (180 days to 540 days), and those that took over 540 days to sell.
|
|
COGS
|
Total cost of goods sold for each category/cost range for the Sold In Period LY quantities.
|
|
In Stock Now
|
The quantity of items in the category/cost range in stock. This is broken down into quantities that have been on hand for less than 30/90/180 days, interim (180 days to 540 days), and more than 540 days.
|
|
Budget
|
Recommended quantity of each of items to buy and the total cost of those items for each category/cost range.
|
|
|
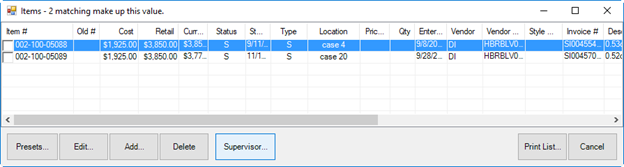
For all of the quantity numbers in the sections Sold Last 12, Sold in Period LY, In Stock Now, you can click on the number and a list of those items that make up that number will appear. That will give you even better insight into what kinds of items are yielding those results.
|